
CDAM’s clients include individuals, reputable corporations and institutions. Table 1 below shows the latest performance measurement of CDAM and MSCI Malaysia Index.
| CDAM | 10.35% |
|---|---|
| MSCI Malaysia | 3.14% |
Table 1: Annual Compounded Rate of Return (April 1998 – May 2026)
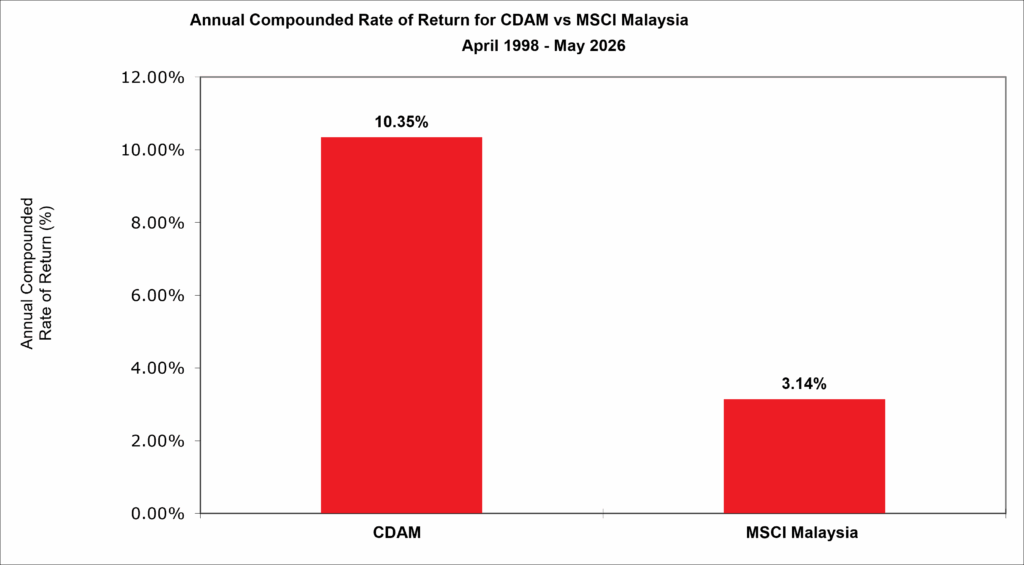
Figure 1: Annual Compounded Rate of Return (April 1998 – May 2026)
During bull markets, all fund managers can perform well. The difference between a good fund manager and a lousy fund manager can only be seen during bear markets. As we all know, you will only know who is swimming naked when the tide goes out as the figure 2 below shows.
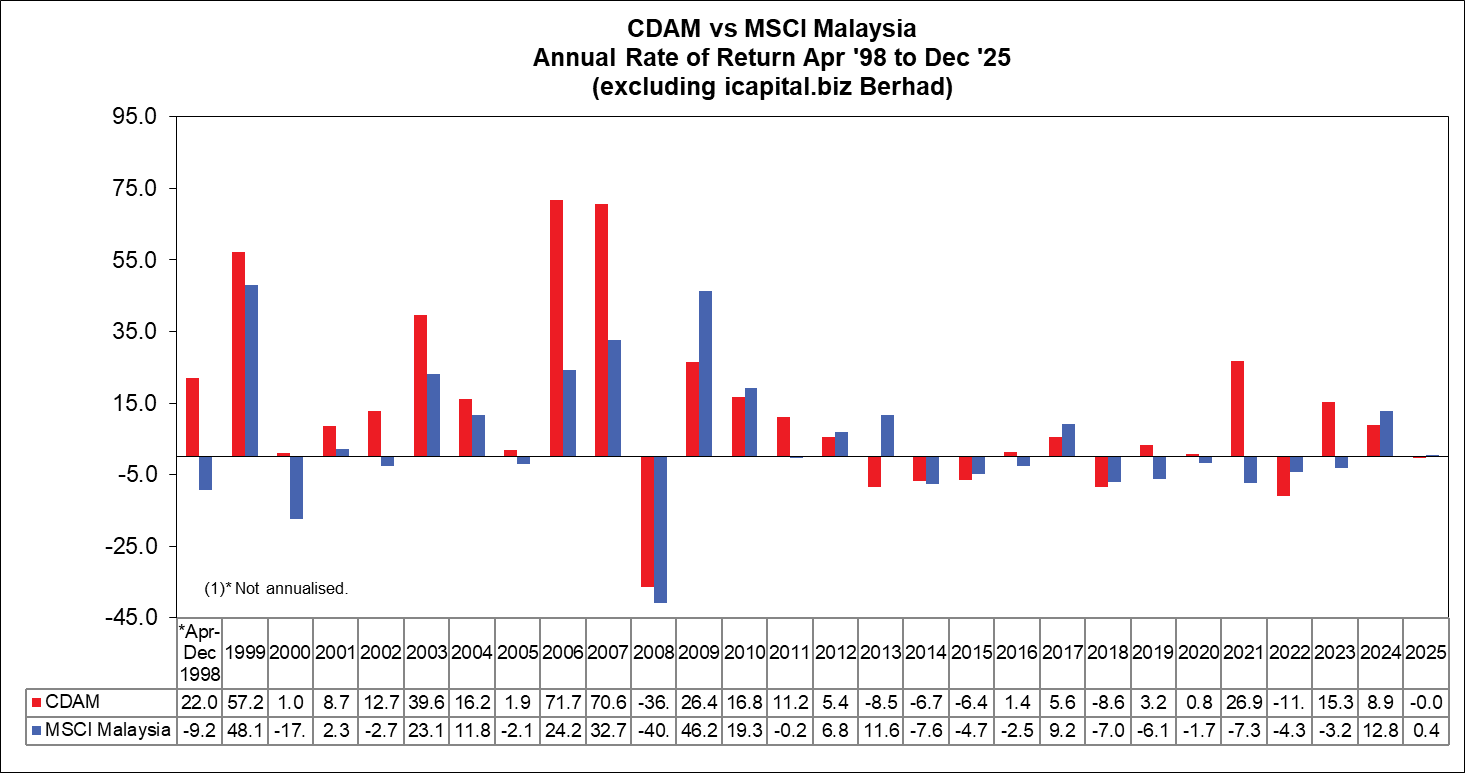
Figure 2: Annual Rate of Return (April 1998 – Dec 2025)
The figure 3 below shows a comparison between the performance of CDAM and MSCI Malaysia from April 1998 to May 2026. If an investor opened an account worth RM100,000 with CDAM in April 1998, by May 2026, the investment would have grown to RM 1,592,309. But if the investor had invested RM100,000 in MSCI Malaysia, the investment would have only grown to RM 238,691.
Even if the investor invested with CDAM during the peak of the market in early 2000, the returns would be slightly more than 5.5 times after 25 years. If someone invested in MSCI Malaysia at the said peak, the investment would only be close to 1.5 times.

Figure 3: Performance of CDAM vs MSCI Malaysia (April 1998 – May 2026)
For more information, please contact us at enquiries@cdam.biz.
Disclaimer
The performance of CDAM for the period 27 Apr 1998 to 31 Dec 2025 has been independently verified. The performance of CDAM for the period 1 Jan 2026 to 31 May 2026 is believed to be reliable, but has not been independently verified. Past performance and any forecast are not necessarily indicative of future or likely performance.